
by Dana Skelly

Fort McMurray residents evacuating in 2016. Credit: DarrenRD
These days, there is hardly a wildland firefighter that hasn’t said or heard “I’ve never seen anything like that before.” We know that wildfires and the fire environment are more extreme each year. Thinking about a shift from a fire season to a fire year is yesterday’s news. Retired Cal Fire Chief Ken Pimlott put it very well:
Folks can say what they want to say, but firefighters are living climate change. It’s staring them in the face every day.
Knowing it is one thing. How do we use that to improve our day-to-day, real-time risk assessments and choices on the ground?
Dolan Fire Deployment, 2020
Last summer I was out as a Fire Behavior Analyst (FBAN) with a Type 1 Incident Management Team on the Dolan Fire in California. Dolan was immediately south of the 2016 Soberanes fire scar on the Monterrey District of the Los Padres National Forest.
While our team was there, the fire grew more in one 24 hour period than any fire had on that district to date, beginning in the afternoon on 9/7. Growth continued through the evening culminating in a final push on the morning of 9/8. This push led to a fire shelter deployment of 14 firefighters that morning, injuring three, one critically.
This happened when so many other fires experienced the labor day East Wind event. Tragedy was rampant up and down the west coast. “Unprecedented” didn’t seem to come close to describing what happened. Prior to this, the most homes burned in a single fire in Oregon was 43 in 2015. Nearly 10 times that number of homes were affected along the Oregon coast alone in 2020. Entire towns were devastated.
Yet on Dolan, when the final push happened—when the deployment occurred—winds were light. Most of the firefighters who deployed were quartered at the Nascimento Guard Station. Their experience told them that they did not need to evacuate the night before. With no howling wind and never having seen growth like that in such a short period, I bet a lot of us would have thought the same thing.
So here we are—we know things are different. If experience alone isn’t enough to assess risks, what do we anchor to?
Fuels Aren’t Recovering Like They Used To
In 2017, we had a winter with average to above-average snowpack across the Western US. An uptick in activity in late June in places not typically active until later in the summer started raising eyebrows. Live fuels were behaving just as you’d expect after a good winter. Fires would check themselves in drainages at night. It was a different story in dead and downed fuels. Where they could preheat live fuels, we saw continued fire growth. By mid-July, heavies were tracking with 2015 levels. 2015 was year 6 of widespread drought. Not what we expected.
In the Pacific Northwest, daytime temperatures have risen an average of 1.3 degrees Fahrenheit over the course of the 20th century.
Dr. Matt Jolly from the Missoula Fire Lab has noted that nighttime temperatures have risen at more than twice the rate of daytime temperatures.
Think about your slides for what nighttime humidity recovery means in terms of available fuels. How off are they with this temperature change? A nighttime recovery of 74% today is not the same for fuels as when temps were lower. Fuels are not getting the same relief that they once did.
There is another index, Vapor Pressure Deficit (VPD), which is similar to relative humidity but instead of being relative, it’s an absolute. It goes up as temperatures go up. It translates to plant stress. It’s not a number you can get readings of in the field to gauge your hourly conditions. But it is more precise than drought levels, can be seen in Fire Family Plus, and can give better context to your fire environment. We saw this on the Dolan fire where VPD hit new extremes while no other index tracked with record-setting growth. FBANs and fire planners can use it to help paint a picture in terms of what kind of fire environment to expect on the line today or on your burn tomorrow.
Small Changes = Less Fragmented Fuelscapes = Larger Fires
When the Dolan fire grew last September, we had an absence of the marine layer for several days before things broke open. Marine layers come in along our west coast, usually at mid-elevations, and create a break in the fire environment above and below them. Above a marine layer, things can be much drier and more active than you’d expect, even overnight. The layer creates a cap where below it, fire will smolder. You can have holdovers that pop up weeks or even a month later when the marine layer finally recedes.
This breaks up the continuity of fuels across a landscape. Even if the fire is raging above this layer, fire will not rush through it. You can only get so much momentum when your fuels are fragmented this way.
When the marine layer breaks you now have one continuous fuelscape. Everything has become available.
Fuelscape continuity on a larger scale
Scientists have been putting together how increasing temperatures translate into the what we see on the ground. This graphic shows how these temperature changes have increased available fuels and how that plays into increased fire footprints:
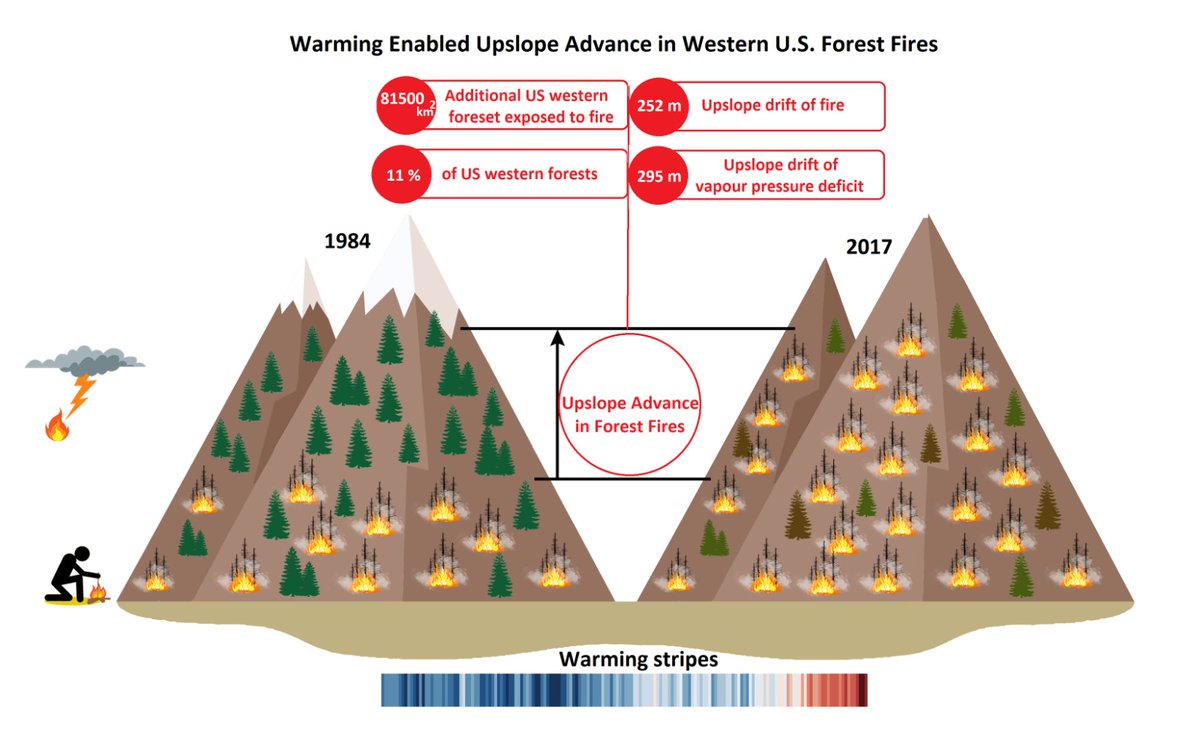
Image Credit: Mohammad Reza Alizadeh. 81,500 square km = 20,139,089 acres.
Based on this research, increased temperatures from 1984-2017 have resulted in 20 million acres added to our fuelscape. Historically, elevation and aspect disrupted the continuity of available fuels. They created natural, temporary fuel breaks. These natural breaks are much less reliable every year. In other words, we not only have more fuel available, but we also have a more continuous fuelscape. Any given start now has an opportunity to build more momentum than we have seen before. There is less to slow or stop it. That translates into what we see increasing each year: rapid, intense, and explosive fire growth.
Bring It
The most important thing to know on the ground today? Recognize that what you are calibrated to equate in your mind in terms of RH/fuels/fire behavior is not current. It will lead you to underestimate risk.
When I brief crews on an incident, I know they will see things that no one has seen before. We are routinely asked to make tough decisions in a dynamic setting with little information or time. The fire environment has been changing exponentially in recent years, but our strategies and tactics have been slow to catch up. Getting everyone to the same baseline is the key to support the critical thinking we need.
- Increases in temperature mean more widely available fuels & increased diurnal wind flows.
- Fires burn more actively later into the evening.
- We are seeing longer duration, more intense wind.
- We are seeing longer periods of lower humidities.
- Today’s July fuelscape is like yesterday’s late August fuelscape.
Thom Porter, the current chief at Cal Fire, has a great way of framing what we see today.
“They talk about career fires. And a career fire was sometimes on the order of 10,000 to 50,000 acres. 50,000, that was crazy….Once in a career. It dawned on me at one point that career fires are happening every single year, right now.”
A friend reminded me of an old saying that still applies, “Fire provides the test before the lesson.” For any of us out there, all of this comes down to a fundamental question: how do I fight fire aggressively while providing for safety first today? So that we all come home.
Head on a swivel is good. Getting your head around how the gameboard has changed and will continue to change—even better.
Good thoughts on an important topic. The laws of physics haven’t changed, but the climate has been changing as you describe and intersecting with problematic fuel conditions due to drought, disease, insects, and (especially) historic fire exclusion. On an incident, the FBAN has a great opportunity to inspire operational personnel. Maintaining good communication with Ops chief, branch directors, and division/group supervisors is vital; my approach has been to keep those conversations going early and often, and ideally this will be synergistic towards achieving incident objectives. Incident briefings provide a limited time slot when you must hit the key points related to fireline tactics that will resonate with line personnel. I aspire to inspire using an approach that integrates the key fire weather messages with landscape features/conditions and known strategic plans. It’s also a chance to reinforce potential heads up situations (that you know that Ops folks will be speaking about in division breakouts) including the probability of major crown fire runs, the impact of t-storms, possible collapse of pyro-cu, and the likelihood/location and resistance to control regarding spot fires. It is also valuable to state that the IMET and FBAN are laser focused on the big picture fire environment and that you’re there to support their safety and success.
Thanks Jesse! Great insights and advice. So many pieces are spot on, the one I’ve been referencing most lately is how to be strategic with limited resources by highlighting areas with most resistance to control nearest to our highest priority values at risk. It seems like we are always in triage mode these days and that skill set has been well used.
Thanks for the note Dana – and good thoughts too Jesse. Concentrating on what the weather/fuels/topgraphy interactions will be rather than on the ROS and FL is the only way we can really convey what we think is going to happen. Integrating the IMET ever more into information for operations is critical – especially when you are one FBAN on a fire that is well over 100K acres and has active fire fronts in multiple drainages. Kind of hard to keep up with all the bits and pieces. As was said – you have to pick out the parts that are the most critical and also keep the big picture in mind. We are hitting thresholds for fire behavior that are new and sometimes the transitions are far faster than we think will happen. Ferocious is the only way I can describe some of the fire activity I have been seeing the last few years.
That’s exactly where I’ve come to on this too, Tobin. Ferocious is spot on. When I brief these days, I try to focus on what I want people to be watching for to help make better choices. Give them as clear a picture of the context they are operating in as I can.
Howdy Dana
You made some very good points and assessments. The warmer nights equate to longer burning periods and we might be able to predict a crown fire rate of spread but how does one predict the length of the burn period? On large fire assignments I like to keep an eye on other large fires in the area/region that have similar fuel types and that fall in the same general climate/weather zone, which can give you a real heads up to potential fire behavior. I saw that in California in 2020 where some fires were consuming huge acreages every day, and I knew the fire I was assigned to had the same potential and a few days later we had a 30 mile spread event in like 30 hours. It was like the burn period was never going to end. The VPD is another great tool for the FBAN kit and I have no doubt it is useful. Lots of great comments here. There are so many challenges we are facing we just have to keep our axes sharp!
Thank you. I hear you. Right now in Oregon we are seeing fires stay active well into the early morning hours. There is more of the day that is the burning period than not it seems. Watching other fires in the area to build SA for your own is an outstanding tip. More than anything I see indirect strategies as a good way to go when fires escape IA. Figuring out how far out those lines need to be to give us time to prep/burn out before they are compromised is something of an art form.
Danna. I agree on the indirect strategies. Operations folks need to concentrate on values at risk as you mentioned before and it is very important to stick to the basics; anchor, flank, mopup and patrol and hold what you have in hand and can realistically do. Knowing how far any individual fire can spread in a day is becoming even more important for safety of firefighters and the public, and figuring out strategies and tactics.
Persistence of fire behavior is a good tool for an FBAN to watch, and fire progression maps are invaluable. If the weather, fuels, and topography stay pretty much the same the fire is going to behave the same way tomorrow as it did today; of course there are many exceptions to this rule. I like to watch for patterns in the progression maps where you get elliptical fire spread in specific areas on your map and these patterns may persist for several days. Sometimes those day to day patterns of fire spread don’t seem to make much sense, and they can be caused by wind vortices that develop on the lee side of ridges and can extend out for several miles. I call those types of vortices “leaders”, somewhat like the leading edge of a lightning bolt.
There is a great deal of science and art to the FBAN job and the hardest part of that position to me is communicating to operations personnel potential fire behavior, and getting their feed back. Its easier said than done.
Your description about vortices is something I had not dialed in that way, very helpful! I am going to adopt that, thank you.
I completely agree with you on the connection with operations and how hard that can be. I was very careful before I chose to commit to a team for exactly those reasons. The team I am on (PNW2) is amazingly inclusive. I’m on the ops text threads for example. I know that is not always the case and it would be great to hear about other teams that do that.
Danna: The vortices I was referring to are eddy winds that form on the less sides of ridges and they can extend out several miles but its something you really can’t see or measure but it can show up on the maps showing daily fire spread perimeters. Its just one of those things to keep in mind.
In reading about the Dolan Fire entrapment they talked about not having howling winds, and they figured there was no need to evacuate the evening before. Yes it can happen to anyone especially when ERC values are above 90%, and fire behavior predictions are much harder to make.
…and speaking of winds. I keep on eye on the Haines Index, a measure of lower atmospheric dryness and instability. It can be an indicator of higher potential for an existing fire to grow large or exhibit extreme fire behavior. In my experience when the Haines reaches a 5 (moderate potential) its something to watch especially above 90th percentile ERC. Generally at a 5 or 6 I have seen increased fire spread rates but not large fire growth, but a few times I have seen massive fire spread with plume dominated (or partial plume dominated) fire. I did a fire assignment in New Mexico and we had a massive plume dominated fire erupt on a day that winds were forecasted to be light with a forecast of Haines of 5 for the afternoon, and in the period of an hour we had the fire go from a spreading surface fire to a 30,000 foot plume with rampant crown fires. It happened real fast. There has been vigorous debate over the years and some folks say the Haines Index is not a good tool or doesn’t work in their region or state. The Haines Index is just a tool and it can be helpful and the forecasted Haines is something to keep a watch on. The problem is the Haines Index isn’t an input to any fire model and its not something you can calculate in any way, shape or form. Thus the art of fire prediction with a wee bit of fire weather science thrown in.
Great topics to debate and discuss!